forex Trading , cryptocurrency, & stocks using 200 exponential moving average can become profitable if you know the basics. If you trade with the trend, and use 200 EMA properly and effetively. In today’s article. let’s discuss why 200 EMA indicator can be a useful trading indicator whether your using TradingView chart, or Meta Trader trading platform.
Insert 200 EMA Trading Indicator in Meta Trader Platform
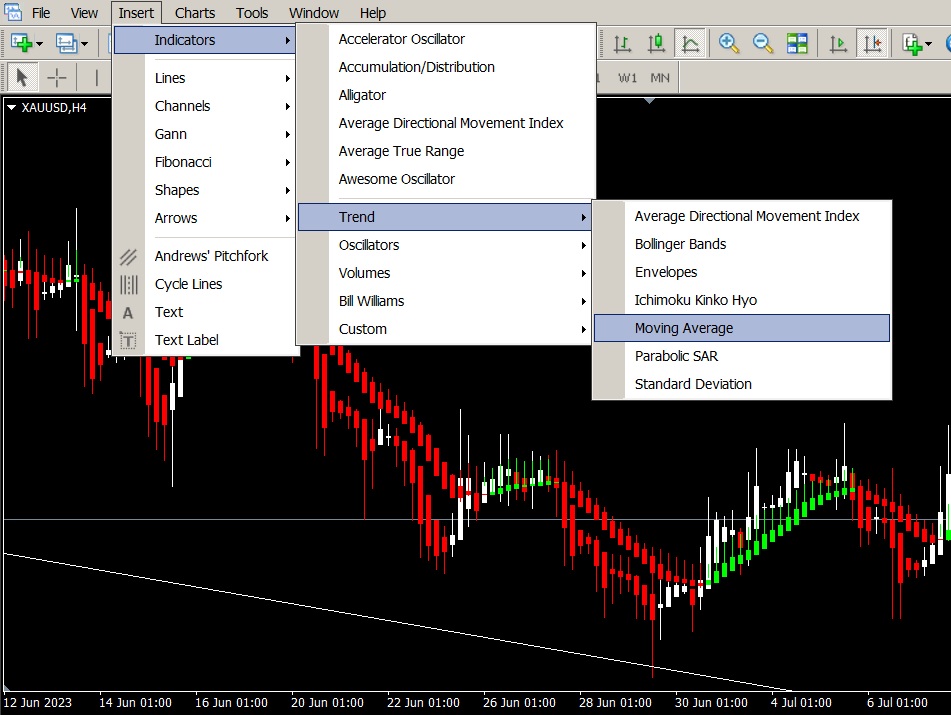
Open your Meta Trader trading platform. Go to “insert”options. Choose indicators. Under Trend indicators, select moving averages.


After you selected moving average, set the parameters
- Period: 200
- Shift: 0
- MA Method: Exponential
- Apply to: Close
How to Use 200 Exponential Moving Average when Trading Forex, Cryptocurrency, & Stocks
The 200 Exponential Moving Average (EMA) is a commonly used technical indicator in trading for various financial markets, including forex, cryptocurrencies, and stocks. It is primarily used to identify trends and potential trend reversals. Here’s how you can use the 200 EMA in your trading strategy:
Understand the Basics
The 200 EMA calculates the average price of an asset over the last 200 periods, with each period typically representing a day, but it can be adjusted to other time frames (e.g., 4-hour, 1-hour, or 15-minute charts). The EMA gives more weight to recent prices, making it more responsive to current market conditions compared to a simple moving average (SMA).
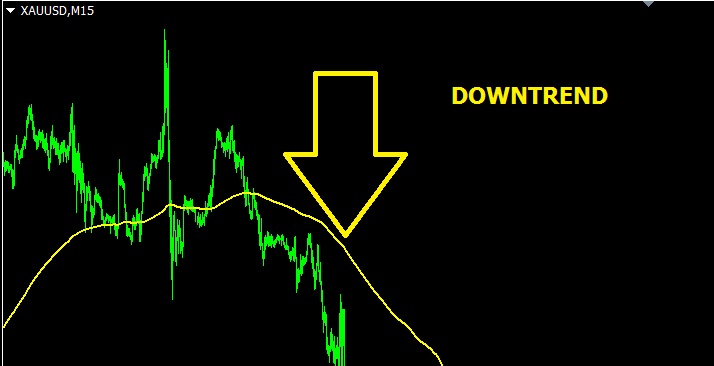
Identify the Trend
In an uptrend, the price tends to stay above the 200 EMA.In a downtrend, the price tends to stay below the 200 EMA. The crossover of the price and the 200 EMA can signal potential trend reversals.
Use as a Trend Filter
Many traders use the 200 EMA as a filter to determine the overall trend direction before making trading decisions.For example, in an uptrend, traders may prefer to take long (buy) positions or avoid short (sell) positions, and vice versa in a downtrend.
Confirm Trend Reversals
A crossover of the price above the 200 EMA from below can be considered a bullish signal. Suggesting a potential trend reversal to the upside. A crossover of the price below the 200 EMA from above can be considered a bearish signal, suggesting a potential trend reversal to the downside.
Use in Conjunction with Other Indicators
The 200 EMA is most effective when used in conjunction with other technical indicators and analysis techniques. Traders often combine it with support and resistance levels, other moving averages (e.g., 50 EMA or 20 SMA), oscillators (e.g., RSI or Stochastic), and chart patterns to make more informed trading decisions.
Set Stop-Loss and Take-Profit Levels
Once you’ve identified a potential entry point based on the 200 EMA and other indicators, set stop-loss and take-profit levels to manage your risk. These levels should be determined based on your risk tolerance and the current market conditions.
Practice Risk Management
Always use proper risk management techniques, such as setting a fixed percentage of your trading capital as the maximum risk per trade. Don’t rely solely on the 200 EMA; consider the broader market context and economic events.
Backtest and Analyze
Before implementing any trading strategy, backtest it on historical data to assess its performance. Continuously analyze your trades to learn from your successes and mistakes and make necessary adjustments.
Remember that no single indicator guarantees successful trading. The 200 EMA is just one tool in a trader’s toolbox. It’s essential to have a well-thought-out trading plan, discipline, and risk management in place to become a successful trader in forex, crypto, or stocks.


DISCLAIMER: The information provided on InvestmentTotal.com is for general informational purposes only. The content on this website is not intended to be, and should not be construed as, professional financial advice.