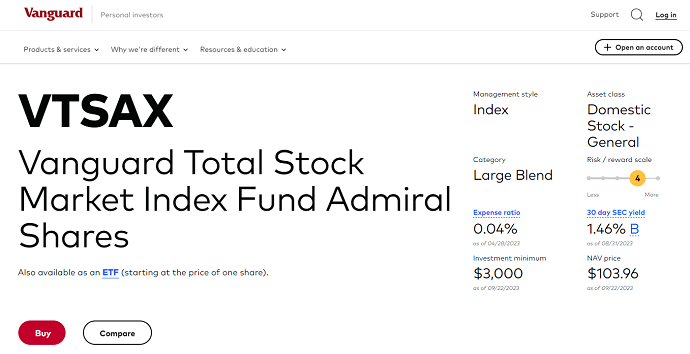
Looking for VTSAX 20-year return? The VTSAX (Vanguard Total Stock Market Index Fund Admiral Shares) is an index fund that falls under the asset class of domestic stocks, specifically in the “Large Blend” category. It is managed using an index investment style, with an expense ratio of 0.04% as of April 28, 2023. Launched in the financial landscape of 1992, the Vanguard Total Stock Market Index Fund was crafted with a mission – to offer investors a comprehensive gateway into the vast U.S. equity realm. It encompasses the dynamic spectrum of small, mid, and large-cap stocks, both in growth and value segments.
What makes this fund shine are its remarkable attributes: remarkably low expenses, a wide-ranging diversification strategy, and the prospect of tax efficiency. For those who seek a financially savvy approach to access the sprawling U.S. stock market, and are prepared to embrace the fluctuations intrinsic to stock investments, this fund emerges as an appealing choice. Whether you’re building the cornerstone of your equity portfolio or contemplating it as your sole domestic stock fund, the Vanguard Total Stock Market Index Fund stands ready to accompany.


VTSAX Performance
Since its inception on November 13, 2000, VTSAX (Vanguard Total Stock Market Index Fund Admiral Shares) has delivered impressive returns, with a cumulative growth of 443.50% over its lifespan. This translates to an annualized return of 14.70%, demonstrating the fund’s consistent performance in the financial markets. Additionally, the fund has outpaced its benchmark by a substantial margin, with a total return of 215.41% compared to the benchmark’s 62.22% over the same period.
As of August 31, 2023, the 30-day SEC yield for VTSAX is 1.46%, indicating the fund’s annualized income return based on the past 30 days.
The minimum investment required to enter this fund is $3,000 as of September 22, 2023, and the NAV (Net Asset Value) price of one share of VTSAX is $103.96 as of the same date.
VTSAX Performance
Over the past 15 years, the investment’s performance has shown varying results:
- In 2022, it experienced a capital return by NAV of -20.81%, an income return by NAV of 1.28%, resulting in a total return by NAV of -19.53%. This performance was slightly worse than the benchmark, which had a total return of -19.49%.
- In 2021, the investment had an impressive year with a capital return by NAV of 24.09%, an income return by NAV of 1.63%, and a total return by NAV of 25.71%. It outperformed the benchmark, which had a total return of 25.72%.
- In 2020, it posted a capital return by NAV of 18.89%, an income return by NAV of 2.10%, and a total return by NAV of 20.99%, which closely matched the benchmark’s performance.
- Over the 15-year period, the investment generally had positive returns, with only two years (2008 and 2015) showing negative total returns.
- The best year for the investment was 2013, with a total return by NAV of 33.52%, significantly outperforming the benchmark.
- The worst year was 2008, during the financial crisis, with a total return by NAV of -36.99%, which was slightly worse than the benchmark’s performance.
Summary of VTSAX 15-Year Return
This investment has shown overall positive performance, with some years outperforming the benchmark while others lagged behind. It’s important for investors to consider the long-term trends and historical performance when making investment decisions, taking into account both the positive and negative years. Additionally, it’s advisable to consult with a financial advisor to make informed investment choices based on individual financial.
VTSAX $10,000 Investment on 2008
To calculate the value of a $10,000 investment made in 2008, we need to consider the annual returns of the investment over the years. Since I don’t have access to real-time investment data beyond September 2021, I’ll provide a simplified example based on historical data up to that point. Please note that real investment values can fluctuate significantly over time, and the following calculation is for illustrative purposes only.
Let’s assume the investment experienced the same returns as the benchmark mentioned earlier for the years following 2008. Here are the returns for each year from 2008 to 2021:
- 2009: -37.04%
- 2010: 17.28%
- 2011: 1.08%
- 2012: 16.44%
- 2013: 33.51%
- 2014: 12.58%
- 2015: 0.40%
- 2016: 12.68%
- 2017: 21.19%
- 2018: -5.17%
- 2019: 30.84%
- 2020: 20.99%
- 2021: 25.72%
To calculate the value of a $10,000 investment made in 2008. we multiply the initial investment by the annual returns, one year at a time:
1. In 2009: $10,000 * (1 – 0.3704) = $6,296
2. In 2010: $6,296 * (1 + 0.1728) = $7,380.87
3. In 2011: $7,380.87 * (1 + 0.0108) = $7,465.76
4. In 2012: $7,465.76 * (1 + 0.1644) = $8,696.67
5. In 2013: $8,696.67 * (1 + 0.3351) = $11,704.51
6. In 2014: $11,704.51 * (1 + 0.1258) = $13,246.09
7. In 2015: $13,246.09 * (1 + 0.0040) = $13,297.01
8. In 2016: $13,297.01 * (1 + 0.1268) = $15,043.63
9. In 2017: $15,043.63 * (1 + 0.2119) = $18,298.23
10. In 2018: $18,298.23 * (1 – 0.0517) = $17,309.62
11. In 2019: $17,309.62 * (1 + 0.3084) = $22,538.53
12. In 2020: $22,538.53 * (1 + 0.2099) = $27,273.42
13. In 2021: $27,273.42 * (1 + 0.2572) = $34,310.18
So, if you had invested $10,000 in 2008 and experienced returns similar to the benchmark in the years following. your investment would be worth approximately $34,310.18 as of the end of 2021. Please keep in mind that actual investment returns can vary significantly, and this calculation is based on simplified assumptions.


DISCLAIMER: The information provided on InvestmentTotal.com is for general informational purposes only. The content on this website is not intended to be, and should not be construed as, professional financial advice.