Looking for Facebook stock price history for year 2014? Are you a stockholder of Facebook, Inc. (FB). Here is the historical stock price of Facebook.
Facebook, Inc. is one of the fastest growing. A social networking site founded by Mr. Mark Zuckerberg (Co-Founder, Chairman and Chief Exec. Officer). A US company stock under technology providing internet information. Facebook has 8,348 employees as of 2014. There are about 1.35 Billion Facebook active users as of 2014 3Q. On January 2014, there is a report that Facebook, Inc jump in sales for about 61% and increase its users for about 16%. How do Facebook makes money? FB makes money from sales (usually from advertising sales). Companies tend to advertise online using Facebook. FB attracts advertisers because of its huge numbers of users, just like we have mentioned; there are 1.35 billion users as of 2014 3Q.
Facebook, Inc. Company Profile:
Facebook, Inc. operates as a social networking company worldwide. It provides a set of development tools and application programming interfaces that enable developers to integrate with Facebook to create mobile and Web applications. FB ranked 9 for the most valuable technology brands in the world.


The Executive Officers of Facebook, Inc. (FB)
| Executive Officer | Position |
| Mr. Mark Zuckerberg | Co-Founder, Chairman and Chief Exec. Officer |
| Ms. Sheryl K. Sandberg | Chief Operating Officer and Director |
| Mr. Michael Schroepfer | Chief Technology Officer and VP of Engineering |
| Mr. David B. Fischer | VP of Bus. and Marketing Partnerships |
| Mr. David M. Wehner | Chief Financial Officer |
Facebook Stock Price History 2014
On January 2, 2014 the FB stock price is only 54.83 (open price) while on December 1, 2014 is 77.26, the FB stock price increased 22.43 or about 40.90%. Find out how to choose the best stocks to buy now.
| DATE | OPEN | HIGH | LOW | CLOSE |
| Jan 2, 2014 | 54.83 | 63.37 | 51.85 | 62.57 |
| Feb 3, 2014 | 63.03 | 71.44 | 60.70 | 68.46 |
| Mar 3, 2014 | 66.96 | 72.59 | 57.98 | 60.24 |
| Apr 1, 2014 | 60.46 | 63.91 | 54.66 | 59.78 |
| May 1, 2014 | 60.43 | 64.30 | 56.26 | 63.30 |
| Jun 2, 2014 | 63.23 | 68.00 | 61.79 | 67.29 |
| Jul 1, 2014 | 67.58 | 76.74 | 62.21 | 72.65 |
| Aug 1, 2014 | 72.22 | 75.99 | 71.55 | 74.82 |
| Sep 2, 2014 | 75.01 | 79.71 | 73.07 | 79.04 |
| Oct 1, 2014 | 78.78 | 81.16 | 70.32 | 74.99 |
| Nov 3, 2014 | 75.47 | 78.27 | 72.51 | 77.70 |
| Dec 1, 2014 | 77.26 | 77.31 | 74.80 | 75.46 |
Source: Facebook, Inc. | Yahoo Finance
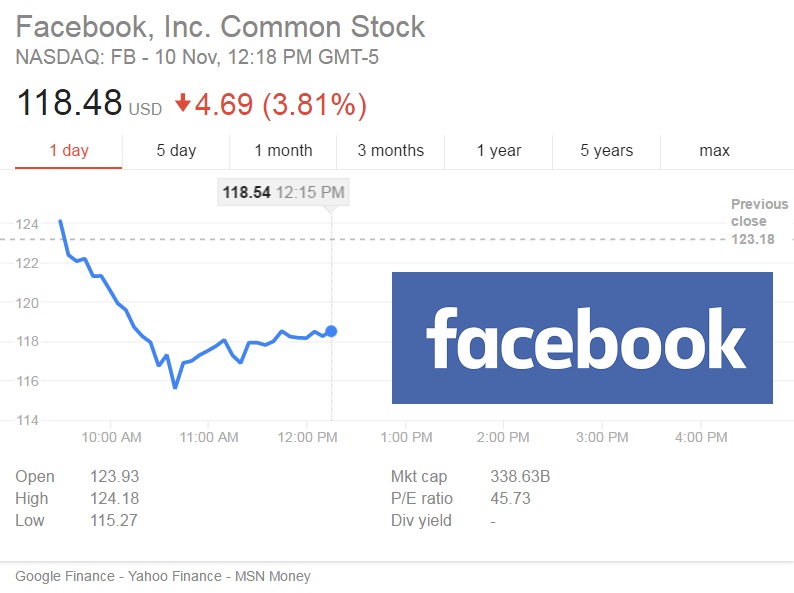
Facebook, Inc. Common Stock (FB) as of Nov 10, 2016


DISCLAIMER: The information provided on InvestmentTotal.com is for general informational purposes only. The content on this website is not intended to be, and should not be construed as, professional financial advice.